plus10 software tools get the most out of existing fill & finish lines at Schwarzkopf
+ 17.4% throughput increase identified by data-based plus10 optimization software. On large, fully automated and therefore confusing fill & finish lines at Schwarzkopf & Henkel, Shannon® and Darwin proved to be particularly beneficial.
Christian Schmitt
January 10, 2023
Short stops, technical faults and cycle time losses in highly automated production plants reduce their overall equipment effectiveness (OEE). To counteract this in the best possible way, plus10 offers data-based software tools that not only identify causal malfunctions and performance losses, but also directly provide concrete optimization suggestions. Shannon® communicates with operators via smartphone, tablet or smartwatch, forming a supportive worker assistance with situational suggestions in real time in case of malfunctions or upcoming activities of the next minutes, such as material shortage of a certain packaging material. Darwin also provides full transparency of cycle times at station level and visualizes the signal history of involved signals of relevant machine components in real time.
Combined use of Shannon and Darwin, specifically designed for highly automated fill-and-finish production lines
The following applies to both the GMP-regulated pharmaceutical sector and the non-GMP consumer goods sector: Especially for large and thus complex, highly automated fill-and-finish production lines that operate around the clock in multi-shift operations, plus10 offers a significant advantage with Shannon, as in the event of a machine stoppage, operating personnel are directed directly to the location of a malfunction—e.g., a specific servo axis in a station—and provided with concrete solutions. This eliminates troubleshooting time and reduces downtime, resulting in higher overall plant productivity. Conversely, the stability of individual machine components—as well as implemented corrective and conceptual optimization measures—can be quantitatively evaluated over several weeks or months of operation.
Through the continuously learning analysis of high-frequency machine data and the simultaneous collection of contextual knowledge from all employees, an increasing number of suggested causes and solutions become available over time when a malfunction occurs. In addition, new and less experienced operators can be trained using the Shannon app with step-by-step instructions. By reducing brief stoppages and downtime, Shannon enables a significant and automatically measured improvement in mean time to repair (MTTR) across all shifts.
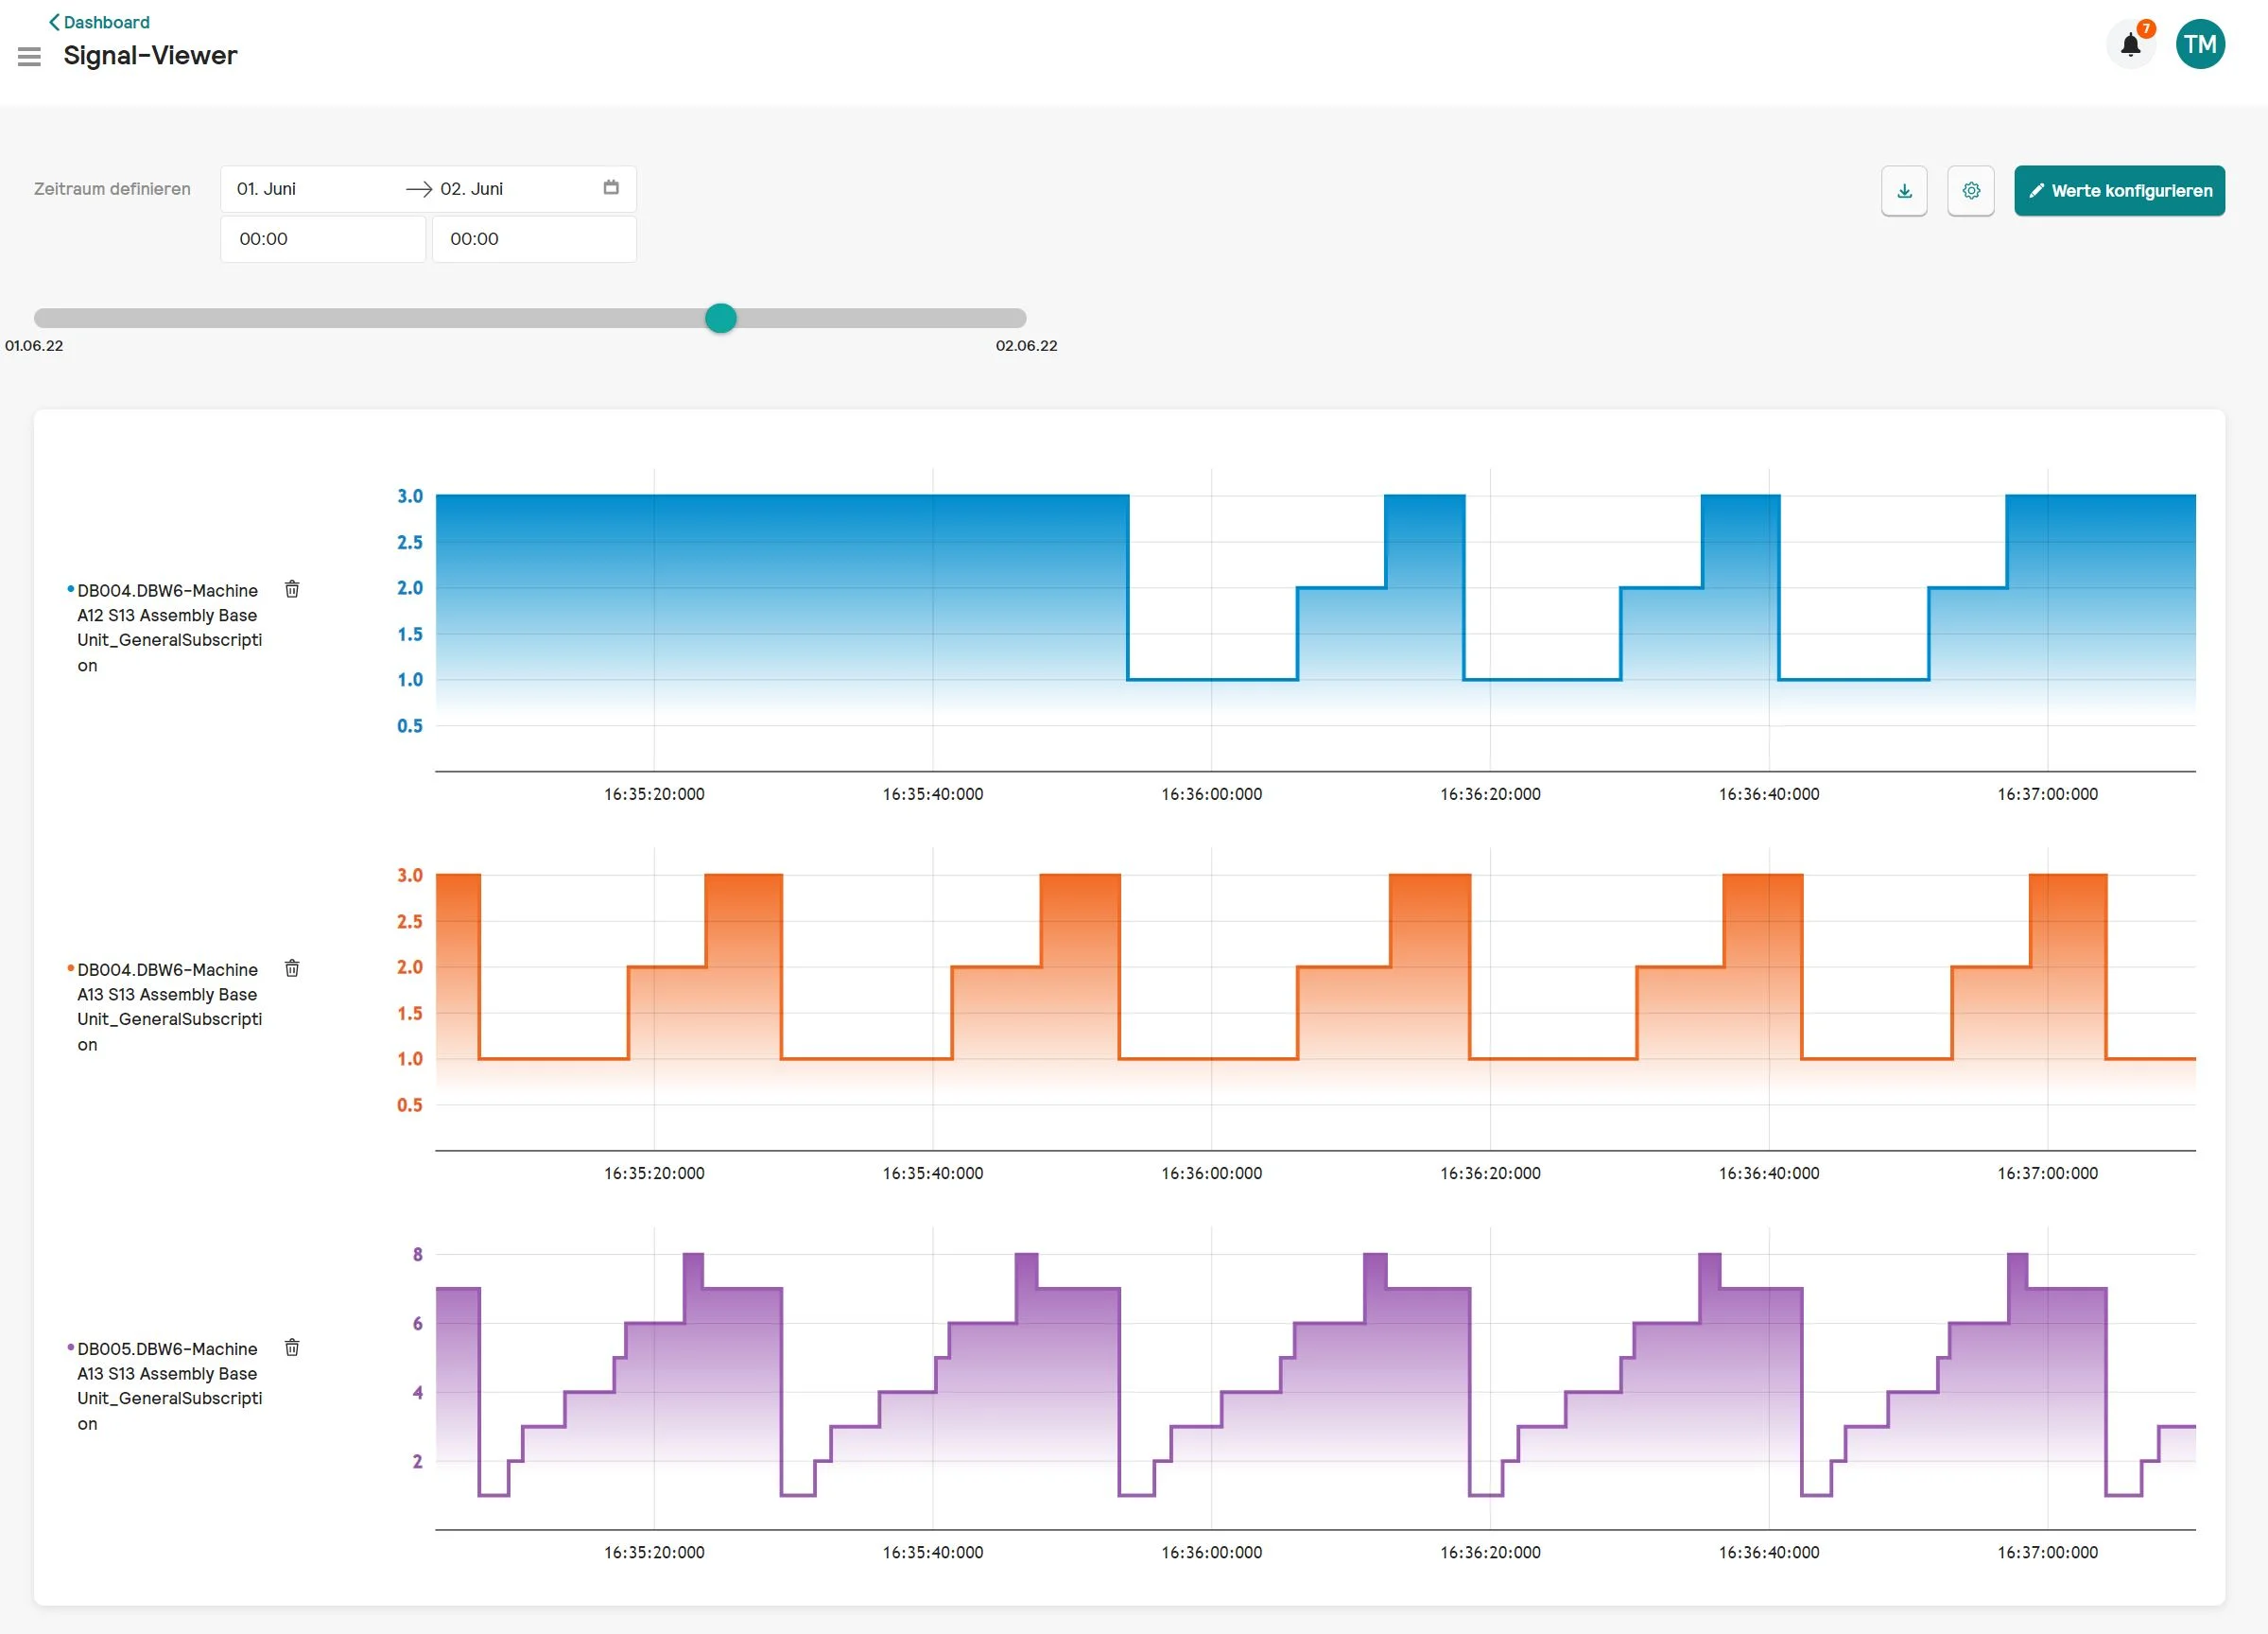
If operations are running smoothly, Darwin, the Machine Performance Finder, provides additional functions to optimize the performance of the line in addition to technical availability. The evaluation of the dynamic bottleneck of the entire line is available at the individual process level on the basis of a cycle time analysis, in order to quantitatively and verifiably initiate programming or design optimization measures and to be able to clearly evaluate their effectiveness after implementation, also using Darwin. In addition, with the Signal Viewer, Darwin offers the possibility to visualize and thus analyze relevant signals over time.
With Darwin's signal viewer function, various signals can be visualized and analyzed.
Specific Use Case: Shannon and Darwin at a Schwarzkopf & Henkel Fill & Finish Line
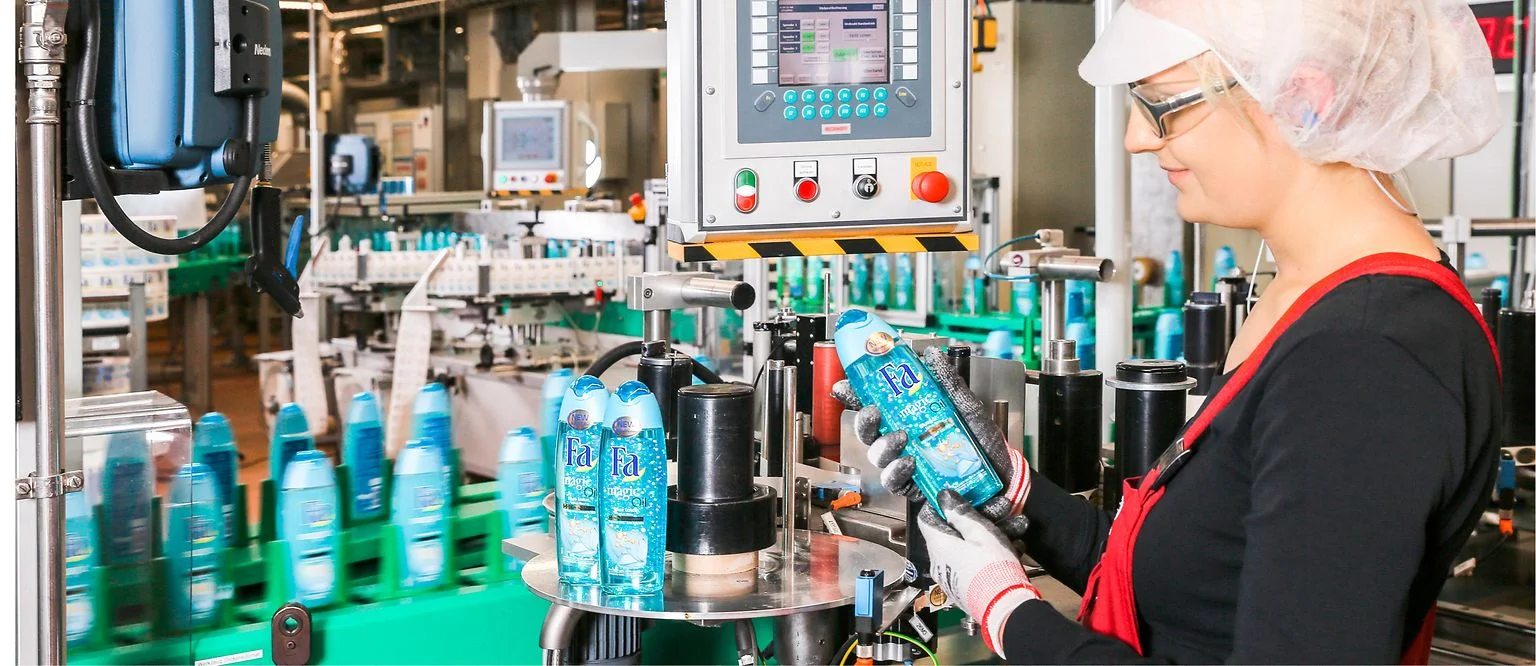
Through the high-frequency data connection of all machine controls involved in the process—of a wide variety of types—via the plus10 DataCollector and the implementation of the Shannon and Darwin software tools, Schwarzkopf & Henkel was able to achieve significant optimization gains in terms of technical availability and plant performance. The focus was on a fully automated and interlinked filling and packaging line for consumer goods with a total of 12 process steps distributed across several stations from different machine manufacturers, all of which were continuously linked together. The initial cycle time was 0.17 seconds. The biggest sources of loss were brief stoppages caused by buffers running empty or becoming full, and the resulting downtime associated with starting up and shutting down the line.
Already in the implementation phase, in which a variety of different PLCs of all generations and manufacturers were connected (Siemens, Beckhoff, Schneider Electric), the intelligent software tools provided process experts at the plant with important insights into plant behavior and technically detailed optimization potential. In this context, data-based transparency about occurring faults (number and duration per shift) could be created, which enabled more effective shift handover and root cause analysis. Based on this, the detailed signal behavior for signal and cycle time analysis was revealed in a data-based manner. Furthermore, Darwin offered several analysis options for experts, which additionally enabled optimization of cycle time and output.
In summary, Schwarzkopf was able to achieve significant added value for its highly automated consumer goods production with Shannon and Darwin:
Detailed transparency of downtime per shift at station level for effective shift handover and basis for conceptual optimization
Detailed transparency of cycle times at station level as a basis for conceptual optimization
Faster root cause identification in the optimization process and during downtimes thanks to visualization of the signal behavior using the integrated plus10 signal viewer
A simulative scenario analysis based on the real plant behavior also provided decisive insights for evaluating alternative material flow designs for the plant. Here, it was possible to analyze how the total throughput of the plant would change in the event of real malfunction behavior of all individual processes if a correspondingly higher or lower number of buffer belts were installed at one point or if control logics for the material flow were changed. The simulation of the different scenarios regarding throughput and utilization could be carried out realistically on the basis of the machine control data made available by plus10 and thus learned behavior models.
The simulation results showed, among other things, that an increase in throughput of + 3.3% is possible by optimizing the number of workpiece carriers. Furthermore, potentials of up to + 4.5% could be identified by simulating the buffer scenarios. The greatest levers for increasing output are the adjustment of belt speeds (+ 16.9% throughput) and the influence of individual stations (+ 17.4% throughput). In general, various losses of different interactions of the interlinked system could be identified with the simulation based on the plus10 data and models.
Overall, it became clear that the implementation and use of the plus10 software tools Shannon and Darwin revealed significant results and potential. Or, in the words of Lutz Kaiser, the operations engineer in charge at Schwarzkopf:
"With the intelligent software from plus10, we were already able to benefit from detailed transparency about downtimes and process times during the implementation phase. The signal-based root cause analysis by the Signal Viewer as well as the detailed fault analysis on station level were particularly profitable. With the help of the simulation based on the data, it was possible to define a package of measures to increase output."
At Fakuma 2026, ARBURG will introduce the Hopper AI tool from plus10, which is integrated into the Gestica control system: The self-learning software analyzes quality-relevant process data in real time and automatically suggests appropriate parameter adjustments to the machine operator to prevent scrap from occurring in the first place. On display at ARBURG in Hall A3, Booth A3-3101.
Injection molding machines provide more data than ever before, yet scrap remains the most costly unsolved problem for many processors. Based on a survey of over 100 plastics processors, plus10 CEO Felix Georg Müller and Dr. Stefan Kruppa (kundu X) show where the real problem lies: not so much in a lack of data as in a lack of the ability to take action. Their solution: Process data becomes process intelligence when the system offers concrete recommendations for action instead of just providing yet another dashboard.
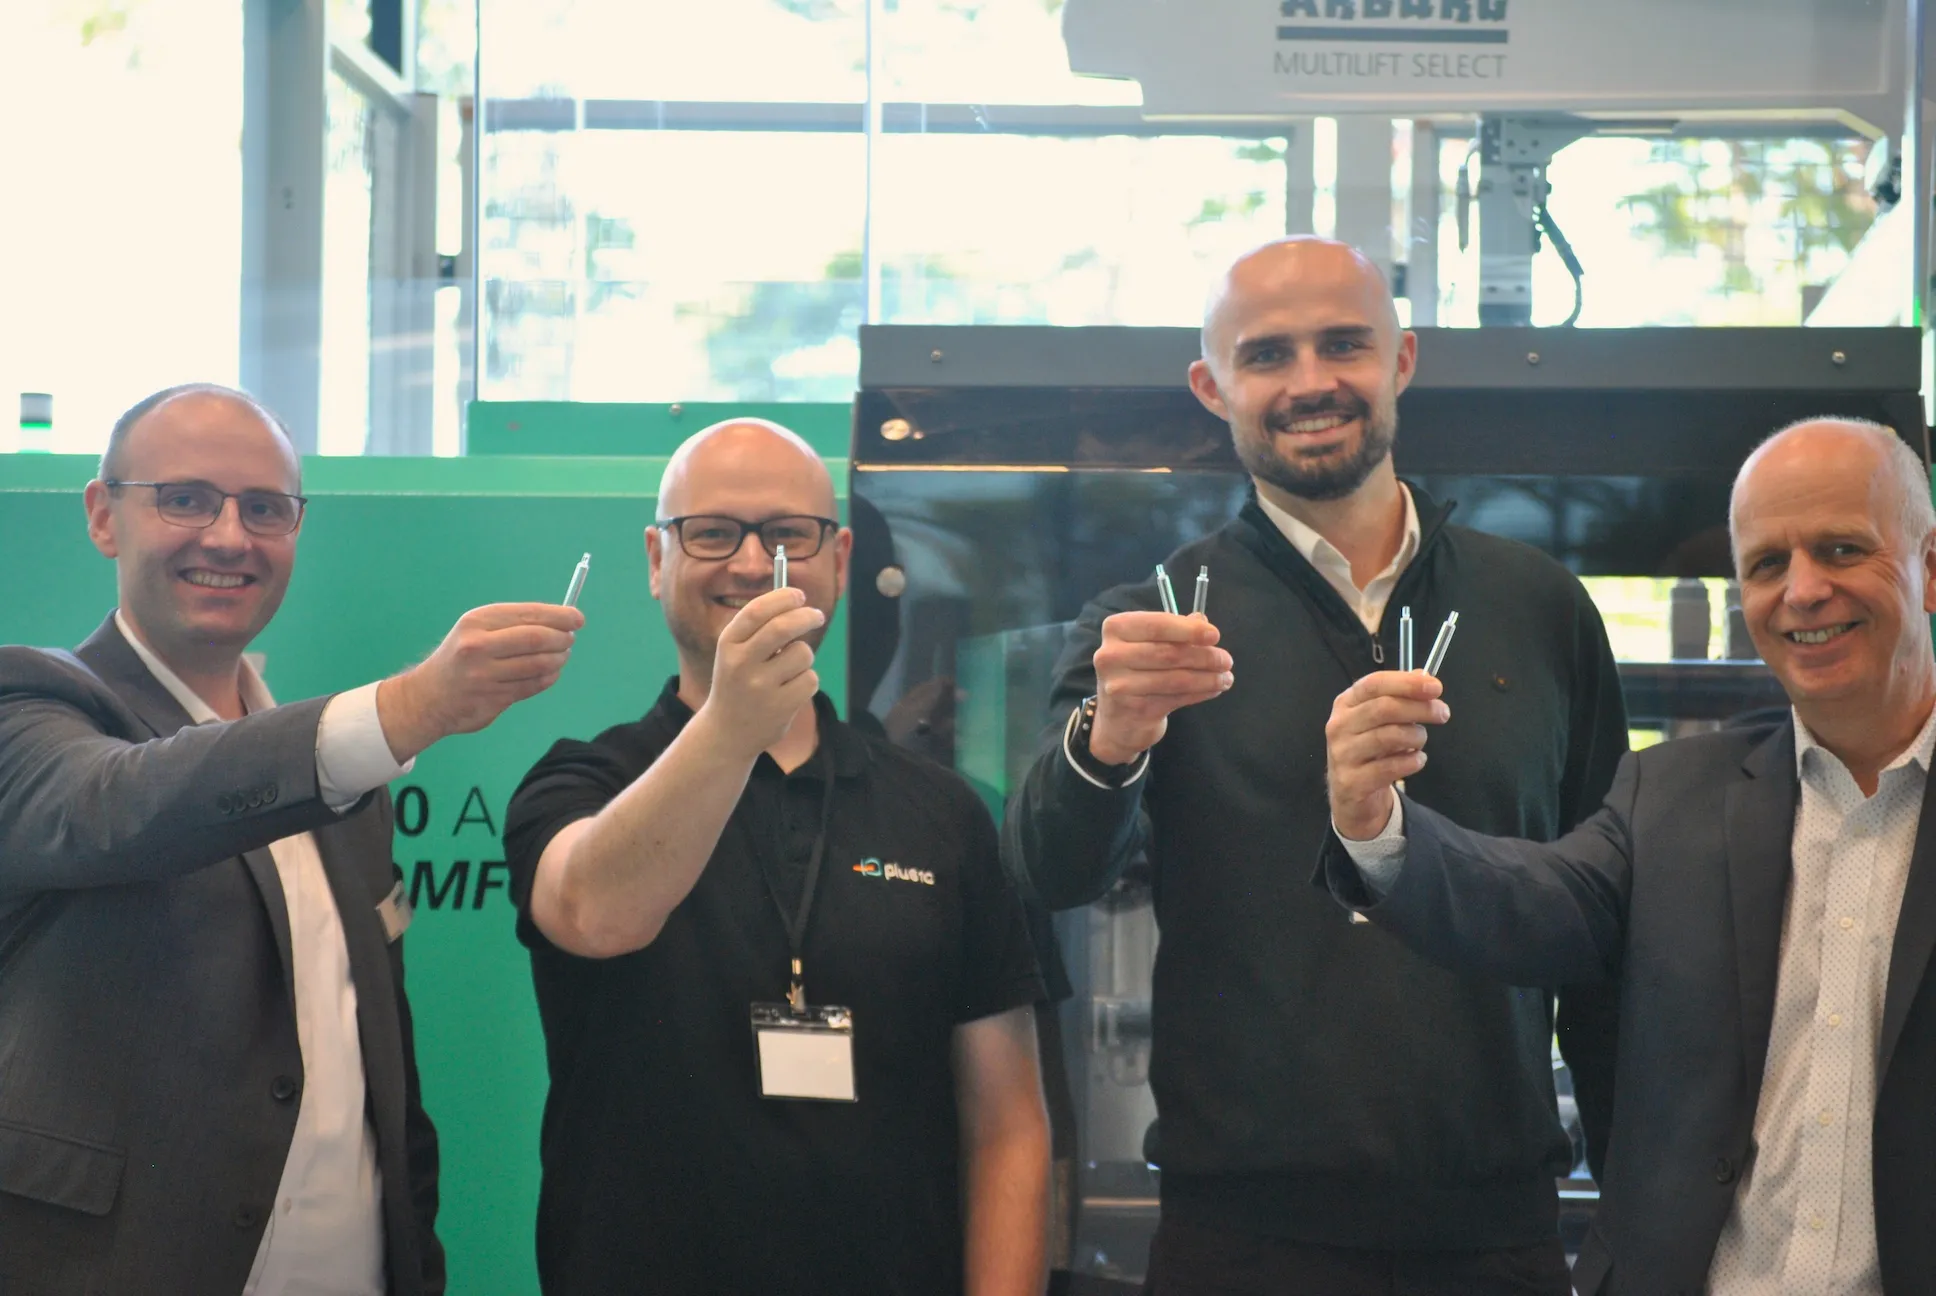
At TechXellence 2026 in the U.S., plus10, together with ARBURG, demonstrated the Hopper AI solution—fully integrated into GESTICA—live on an injection molding machine. The software detects the risk of scrap in real time and automatically recommends appropriate process parameters to reduce scrap and optimize production.




.jpg)