
DARWIN - Identifying the causes of performance losses
Uncover bottlenecks in your production lines and machines and create transparency about the causes of performance losses - down to the signal level.
.webp)
Identify the causes of performance losses
Our analysis algorithms get to the root cause of performance losses of your complex, automated production lines and machines
Optimize production lines in the right place
Only if you know the real bottleneck of a linked production line, you can increase the output in a targeted way.
Darwin continuously determines the real bottleneck based on various factors and thus helps you to perform focused optimizations:
- Breakdown of the real cycle and process times of the individual production stations
- Combination with states of production stations incl. waiting and blocking situations
= Increase of the output of production lines
Identify the cause of performance losses
When looking for the cause of performance losses, the devil is often in the details. A multitude of influencing factors makes it difficult to identify the real cause of cycle time deviations.
Darwin analyzes manufacturing operations at the process step level and allows you to drill down to get to the root cause of timing deviations:
- Process step analysis as drill-down of process time deviations
- Benchmark of similar production lines and machines to identify potential for optimization
= Reduction of performance losses (short stops, process fluctuations)
Detect changes in your production lines and machines at an early stage
A manufacturing process is subject to a variety of influencing factors. If these change and negatively influence the manufacturing process, it is important to react quickly.
With our trend analysis, you can reliably detect changes in process times and in malfunction behavior and react to them quickly:
- Identification of trends in disturbance behavior and process times
- Notification about new trends
= Optimization through targeted, rapid rectification of deviations
Darwin advantages
6-18%
Reduction of cycle time per machine
Up to 38%
Reduction of the average productivity variation
10 - 30%
Shortening the start-up and relocation phase
Darwin solves these production problems.
- No transparency about actual & ideal cycle time behavior
- Complex, fully automated manufacturing processes make it difficult to identify the real cause of output fluctuations
- Output increase only possible with multiple resources
- Similar machines have different productivity
- High fixed and unit costs for fully automated machines
All features of Darwin
Identification of trends
Identification of trends
A manufacturing process is subject to a variety of influencing factors. If these change and negatively influence the manufacturing process, it is important to react quickly.
With our trend analysis, you can reliably detect changes in process times and in malfunction behavior and react to them quickly:
- Identification of trends in disturbance behavior and process times
- Notification about new trends
.webp)
Benchmark of similar machines
Benchmark of similar machines
Similar manufacturing machines often have different levels of productivity. Due to the complexity of the manufacturing process, it can be difficult to identify the cause of different KPI values.
With the machine benchmark, you can compare the performance of similar machines in detail at process step level to identify optimization potential.
.webp)
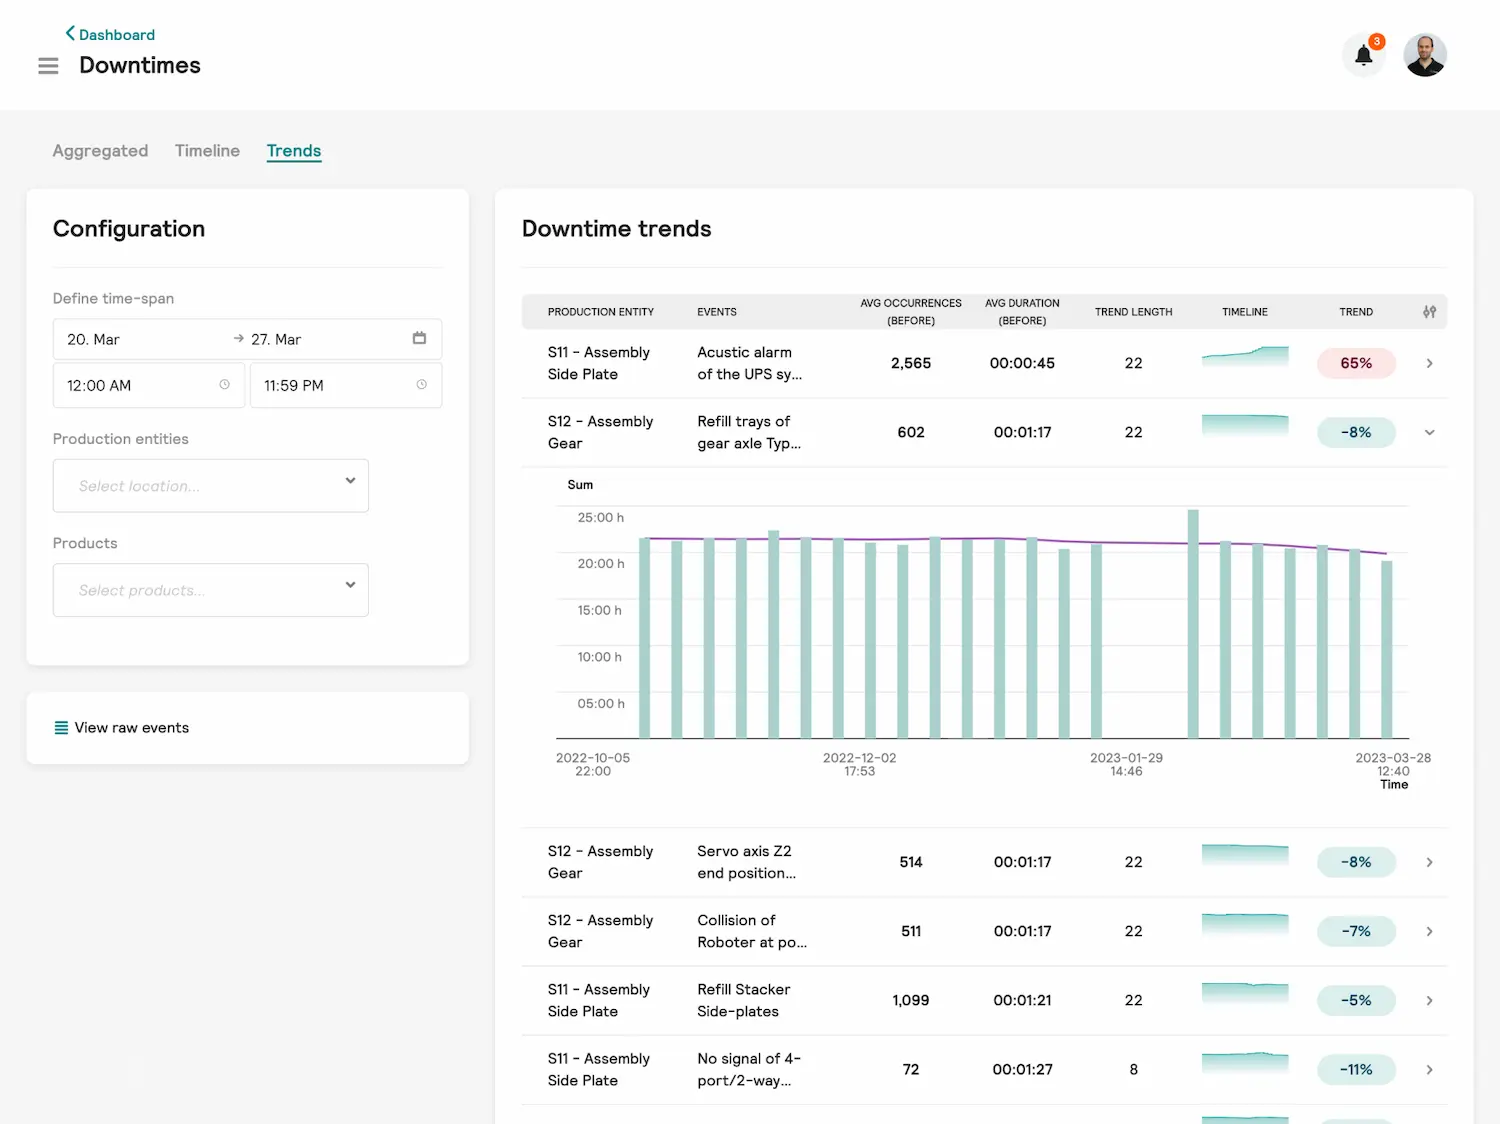
Downtime statistics
Downtime statistics
In order to optimize a production line in a targeted manner, you need good information at hand that clearly identifies problem areas.
To do this, use the statistics on faults to understand which faults caused how much downtime over time. Get detailed statistics to understand the disturbance behavior in detail.
.webp)
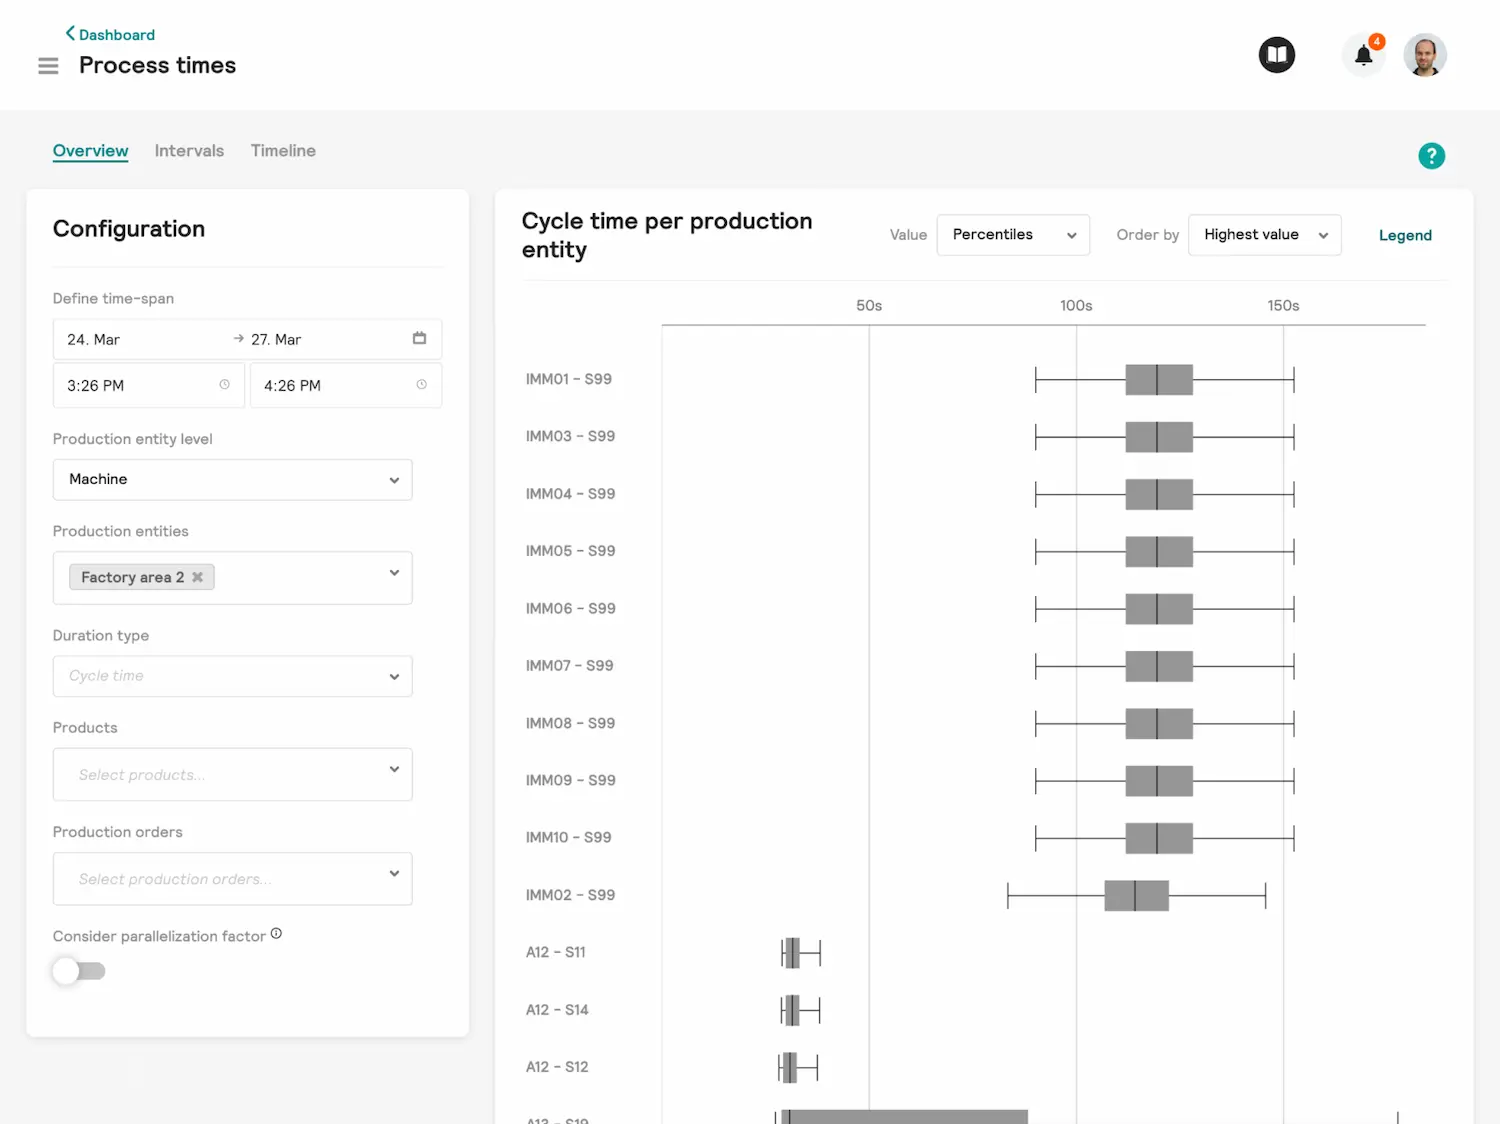
Process time statistics
Process time statistics
Only if you know the real bottleneck of a linked production line, you can increase the output in a targeted way.
Darwin breaks down the real cycle and process times of the individual manufacturing stations, enabling analysis of the performance of the individual components of a manufacturing plant.
.webp)
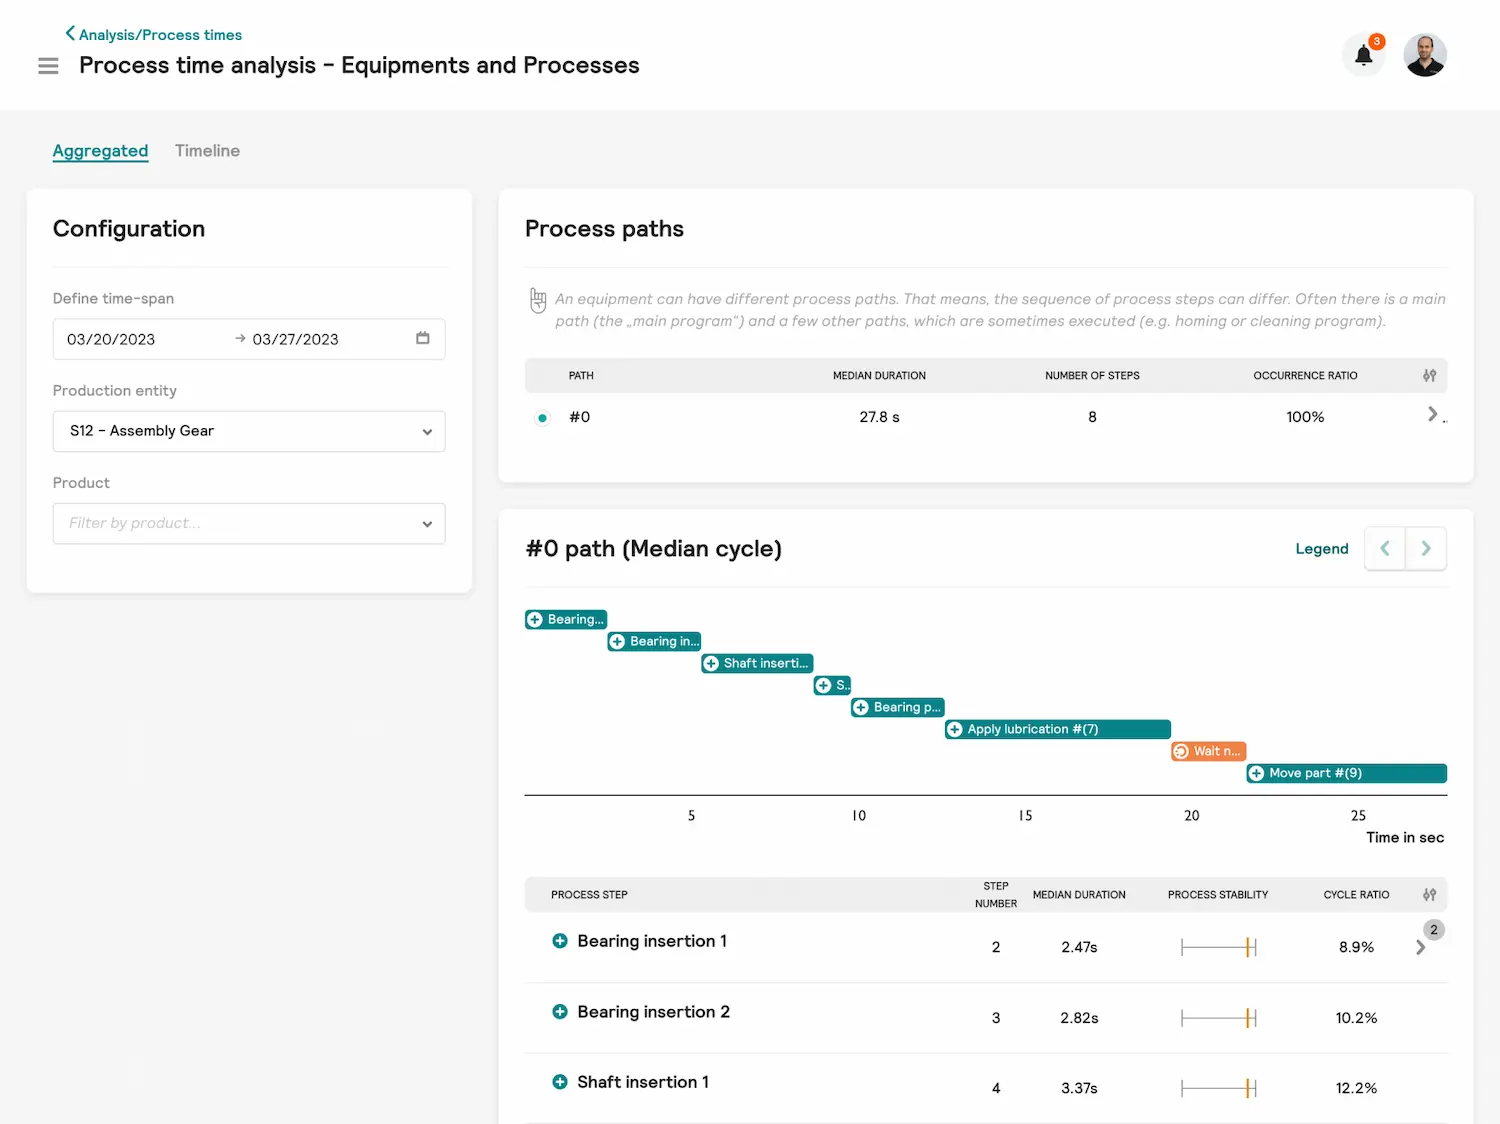
Process Step Analysis
Process Step Analysis
When looking for the cause of performance losses, the devil is often in the details. A multitude of influencing factors makes it difficult to identify the real cause of cycle time deviations.
Darwin analyzes manufacturing operations at the process step level and allows you to drill down to get to the root cause of timing deviations.
.webp)
State statistics
State statistics
Only if you know the real bottleneck of a linked production line, you can increase the output in a targeted way.
Darwin determines the states of production components and thus enables, for example, the waiting and blocking behavior of production stations to be analyzed.
.webp)
KPIs
KPIs
Key performance indicators are an important component of manufacturing optimization to identify problem areas.
Darwin continuously generates key figures for the considered production lines and machines. You can display and group these flexibly to generate the statements that are appropriate for your use case.
.webp)
Interface
Security
Add ons
What our customers & partners say

Shannon® & Darwin at M10 Solar Equipment
- Virtual commissioning of a fully automated solar module production plant with plus10 tools (hardware-in-the-loop simulation) with seven newly developed processes
- Full transparency regarding system behavior and optimization potential in terms of availability and performance
- Faster start-up and smooth handover to operating personnel thanks to virtually trained plus10 tools
Impact: rapid ramp-up and full transparency regarding plant behavior

Darwin at Schwarzkopf
- Fully automated and interlinked filling and packaging line for consumer goods (0.17 sec. cycle time)
- Detailed transparency of downtime per shift at station level for effective shift handover and basis for conceptual optimization
- Faster root cause identification in the optimization process and in the event of downtimes thanks to visualization of the signal behavior
Impact = up to 17% potential for throughput increase identified
Darwin at Haselmeier
- fully automated assembly line for the production of self-injection pens (cycle time less than 5 sec.)
- Identification and quantification of the causes for availability and performance degradation
- Trend analysis on fault occurrence and problem resolution times for each individual cause of loss
Impact = Uncovering of OEE potential greater than 10%.

Request a free use case evaluation now.
- Product presentation with demo
- Roadmap for problem solving
- Holistic evaluation of the approach

More products from plus10
You have questions? We have answers!
And if you have any further questions, please feel free to contact us.
The plus10 software tools provide bidirectional interfaces, either by sharing a database or by native protocols to neighboring IT systems. For example, we can share continuously calculated KPIs on performance and root causes and update your planning, actual and target figures in real time and objectively. Your production planning and control will become much more accurate with feedback from Darwin, Hopper and Shannon®.
We currently support various PLC/NC types. Find out here about the controllers we support or ask us about compatibility with your MES/ERP system.
plus10 collects the data directly from all integrated machine controllers (PLC, NC), robot controllers (RC), etc. of a production machine or from all controllers integrated in a production line. To do this, we use our plus10 DataCollector to acquire high frequency data from all PLCs, NC and/or RC involved. So far we can collect high frequency machine data with different manufacturer specific PLC protocols and we are continuously adding more controllers. Find out more about the controllers we support here or ask us about compatibility with your specific controller type.
If you already have a powerful IT infrastructure installed in your factory, we also offer the connection to your middleware.
Basically plus10 collects and processes all data of the machine control (PLC) of the production machines or the production line in high frequency. The high sampling rate (we are talking about milliseconds) is necessary to detect and assign the causes of problems and not only their consequences. In some cases the RC and NC data of e.g. handling robots are additionally required. In the standard case, no additional sensors or cameras need to be installed.
The plus10 software tools are flexible in terms of IT infrastructure. Data acquisition and pre-processing runs continuously locally, e.g. on an Industrial Edge Device or a virtual machine within the machine control network. For the next processing step, plus10 adapts to your preferred solution: We can provide a cloud environment for our software tools or they can run on a virtual machine on-premise in your existing in-plant data center. Both are possible and we have experience with both options.
Our annual license fee includes standard support and software updates to the latest version of the software service(s) ordered. So with a plus10 software license from Darwin, Hopper or Shannon®, we guarantee you the latest, most efficient and user-friendly version of our optimization software. In doing so, we service production plants worldwide in which our software tools are installed.
This depends on the type of machine controller (PLC) and the existing IT infrastructure. If connectivity to all PLCs exists and you provide the computing infrastructure (either as a local virtual machine or a dedicated server), installation and configuration can be done remotely. In this case, operator training on Shannon®, Hopper or Darwin is still performed on-site, but can be virtualized as video training, even in the case of pandemic closures or access restrictions.
All plus10 software tools are designed to cope with a high degree of complexity in multi-shift production.
Depending on your needs, you can select an appropriate plus10 tool to address your specific production problems:
- Shannon® helps you in the event of malfunctions and technical failures. and thus optimizes technical availability.
- Darwin continuously detects performance optimization potential during operation - either in interlinked and automated process chains or for at least 6 identical individual machines. These machines or production lines can also be located in different plants around the world.
- Hopper lowers your scrap rate in combination with cycle time. This means Hopper helps to reduce high scrap rates or conformity costs and thus optimizes quality.
All plus10 software tools can only be used on fully automated production machines or production/assembly lines, as automatic data input from each process step is required. The operators generally perform logistical and support tasks such as filling or removing material, as well as statistical process checks and troubleshooting in the event of problems.